




Inspectro Documentation
Everything you need to install, configure and master the workspace: a VS Code extension that inspects your running frontend.
Introduction
Inspectro is a VS Code extension that inspects your running frontend. It ties your component tree, your source, and your app's runtime behavior together in one panel, so you can see what a component is, where it lives, and what it's doing, one click from your editor.
The one thing to remember: component ↔ source ↔ runtime, connected live. Everything else is an instrument built on top of that link.
How it works
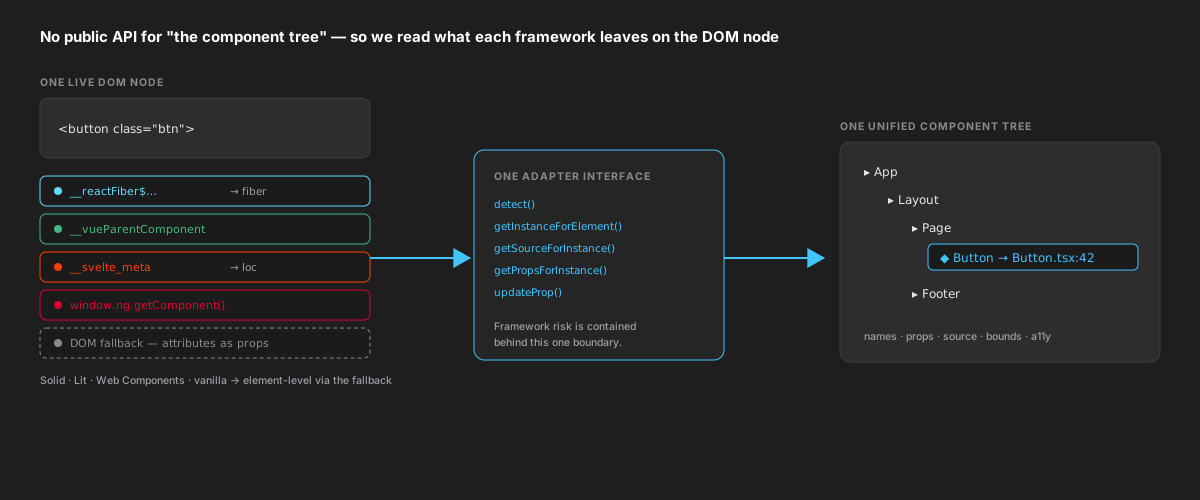
Inspectro doesn't wrap your app or ask you to change your code. When you start your dev server, it runs an HTTP proxy that injects a lightweight agent into the running app. The agent streams what the app is doing (component tree, network, renders) to the DevTools panel over a WebSocket, and the Debug tab attaches over the Chrome DevTools Protocol.
Your framework's components resolve into one common model, so the same tree and the same instruments work across React, Next.js, Angular and Vue.js, with the framework-specific caveats listed below.
The panel is seven tabs (Inspector, Network, Performance, Cookies, Accessibility, Coverage and Debug) with a live Preview always docked on the right, a Console drawer for unified server and browser logs, and Settings a click away.
Supported Frameworks
Every framework below was tested against a running demo app, not inferred from documentation. A framework is only listed as supported when the whole feature set works. A debugger that half-works misleads you, which is worse than one that tells you up front it is not ready.
The four frameworks Inspectro targets, chosen by 2025 usage share: React 44.7%, Next.js 20.8%, Angular 18.2%, Vue.js 17.6%. Those shares overlap rather than add up, because a Next.js app is also a React app. Each is verified against a running app.
- Next.jsApp Router and Pages Router
- Component tree with real component names
- Click-to-source into the file that owns the element
- Props panel: read live, and edit scalars on React
- Network, Console, Performance, Coverage, Cookies and Preview
Anything else gets Inspectro's generic DOM inspector, not a component view. Network, Console, Performance, Coverage, Cookies and Preview still work.
Requirements
Inspectro reads a running app, not your files on disk. These have to be true before it can show you anything.
Known Limitations
These apply in every framework, including React. They are properties of how component metadata reaches the browser, not bugs in one adapter.
Getting Started
There's no CLI and no code changes to start. Install Inspectro, open your project, and run your dev server as usual. Inspectro auto-detects your framework and its port, injects its agent and opens the panel.
Installation
Inspectro installs straight from the VS Code Marketplace: no terminals, no package managers, no configuration required to start.
Configuration
Zero config to start. When you want to tune behavior, every option lives in VS Code Settings under the inspectro.* namespace, and there's no separate config file to maintain.
{
  "inspectro.proxyPort": 0,
  "inspectro.debug.runtime": "dual",
  "inspectro.freshCookiesPerProject": true
}
Features
Eight instruments, one workspace. Each reads the same live link between your components, your source and your running app.
Inspector
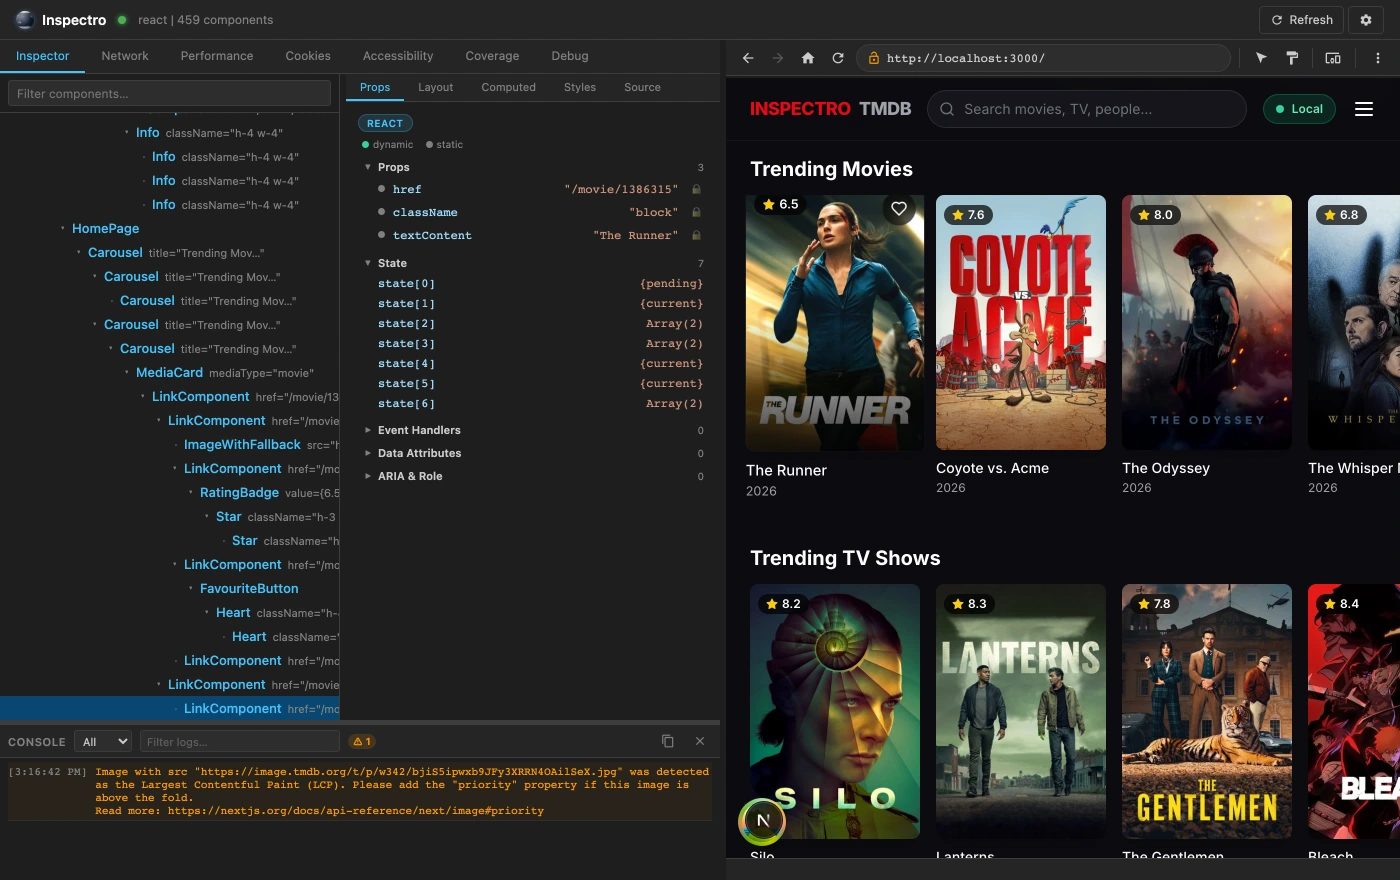
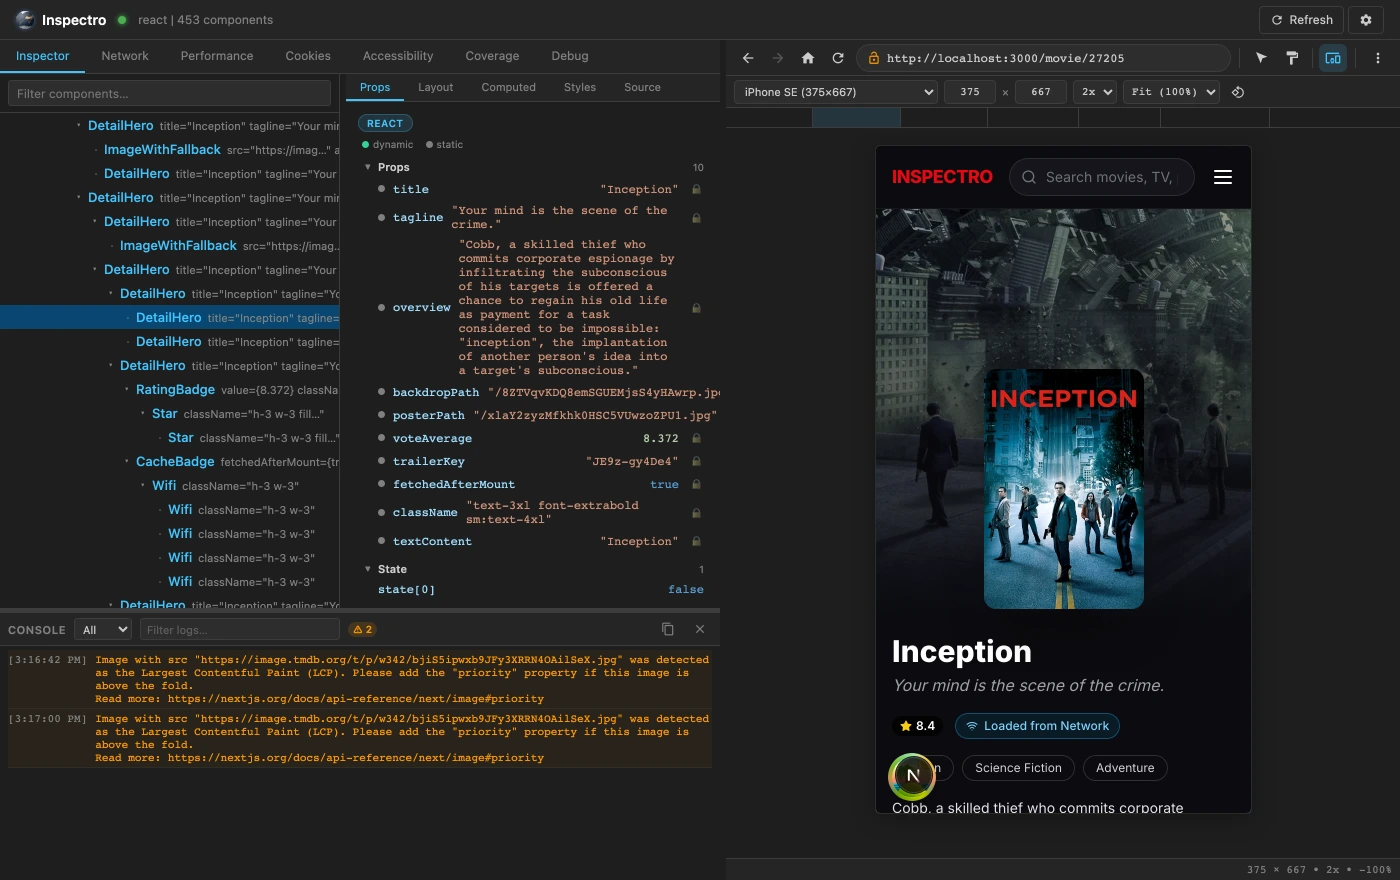
Select any element in the running app and see the component that rendered it: its props, its state, and the exact source line. Then edit React props live.
You're looking at a piece of UI and need to know what component it is, where it lives, and what data it's holding, without hunting through files or scattering console.logs.
Inspectro builds a framework-aware component tree from the running app and keeps it mapped to your source. Selecting an element in the preview highlights its node in the tree and resolves it back to the file and line that produced it.
- Framework-aware component tree across React, Next.js, Angular and Vue.js (see Supported Frameworks for the per-framework caveats)
- Live scalar prop editing for React: change a value, watch the UI update
- Props, state, computed, styles and source in one panel
- Element overlays, a layout inspector and click-to-source
- Write prop edits back to source codeComing soon
- Edit CSS at the sourceComing soon
Network
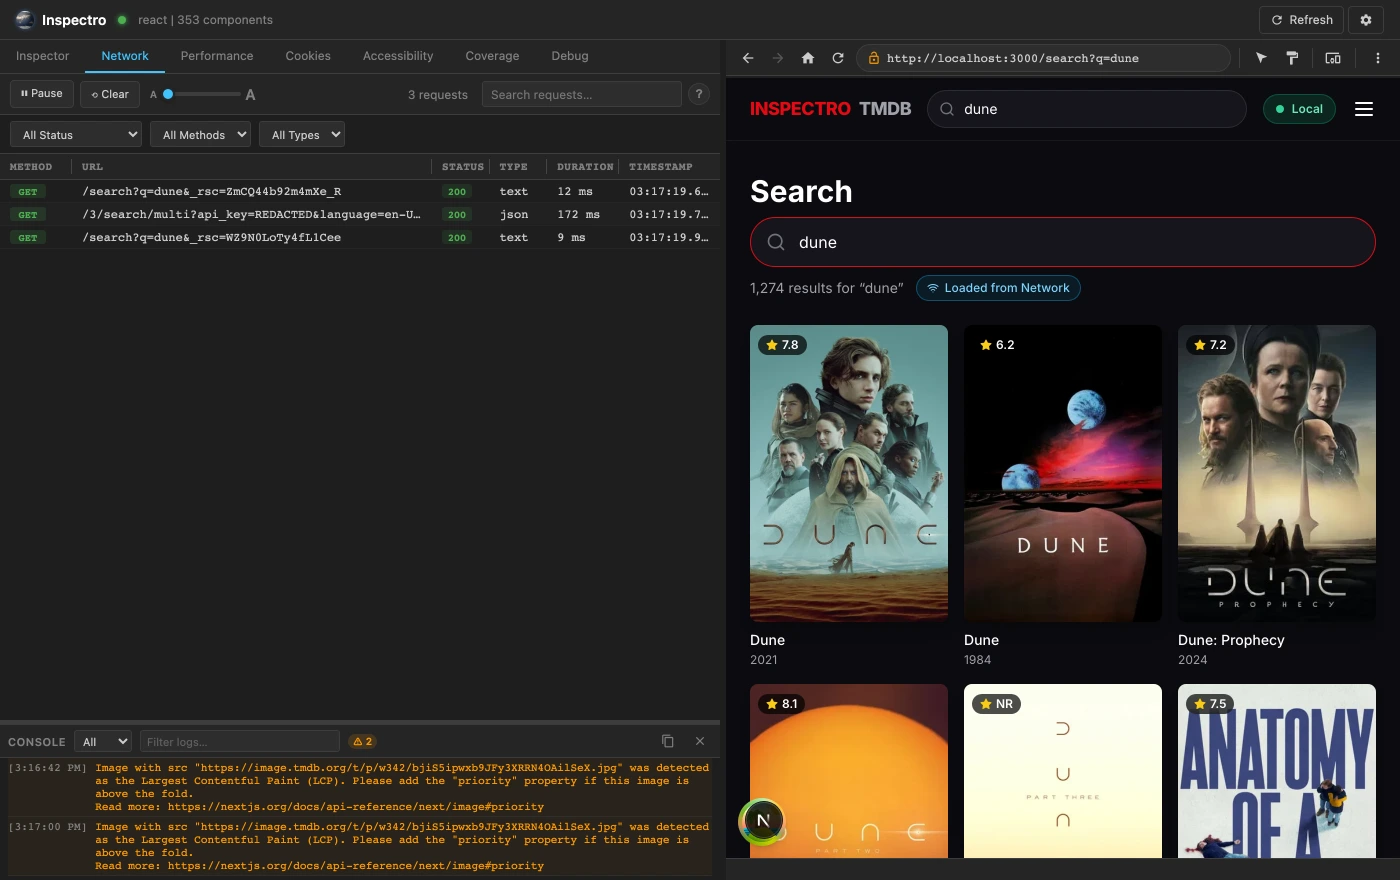
Every fetch and XHR the app makes (request, response, headers, payload and timing) captured continuously and tied to the component that triggered it.
A call fails or returns the wrong shape and you need to see exactly what went over the wire, and where it came from.
The injected agent observes the running app's network activity as it happens and streams it into the panel, correlated with the node in the component tree.
- Continuous fetch / XHR capture, with nothing to arm before it happens
- Full request, response, headers, payload and timing
- Each call correlated to the component that made it
Performance
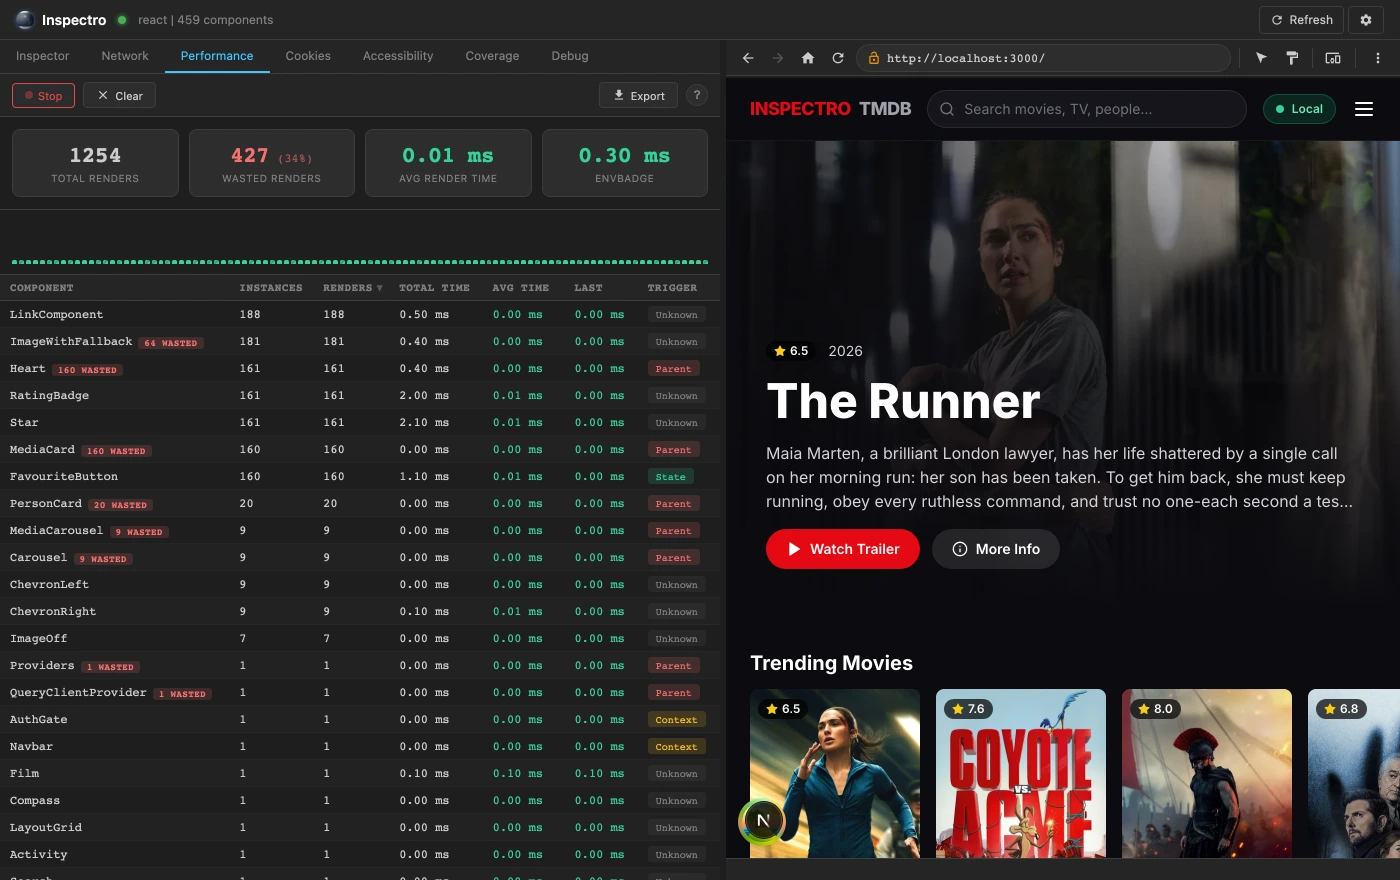
Render counts, render timings and the cause of each render for every component in the tree: measurement, not generic analytics.
The UI feels slow and you need to know which component is re-rendering, how often, and what triggered it.
Inspectro tracks renders per component and the context that caused each one, so a component re-rendering far more than it should stops being invisible.
- Render counts and average render time per component
- Render-cause attribution: what triggered each render
- Wasted-render detection
- UI Time Machine: timeline replay of every render and prop changeComing soon
Cookies & Environments
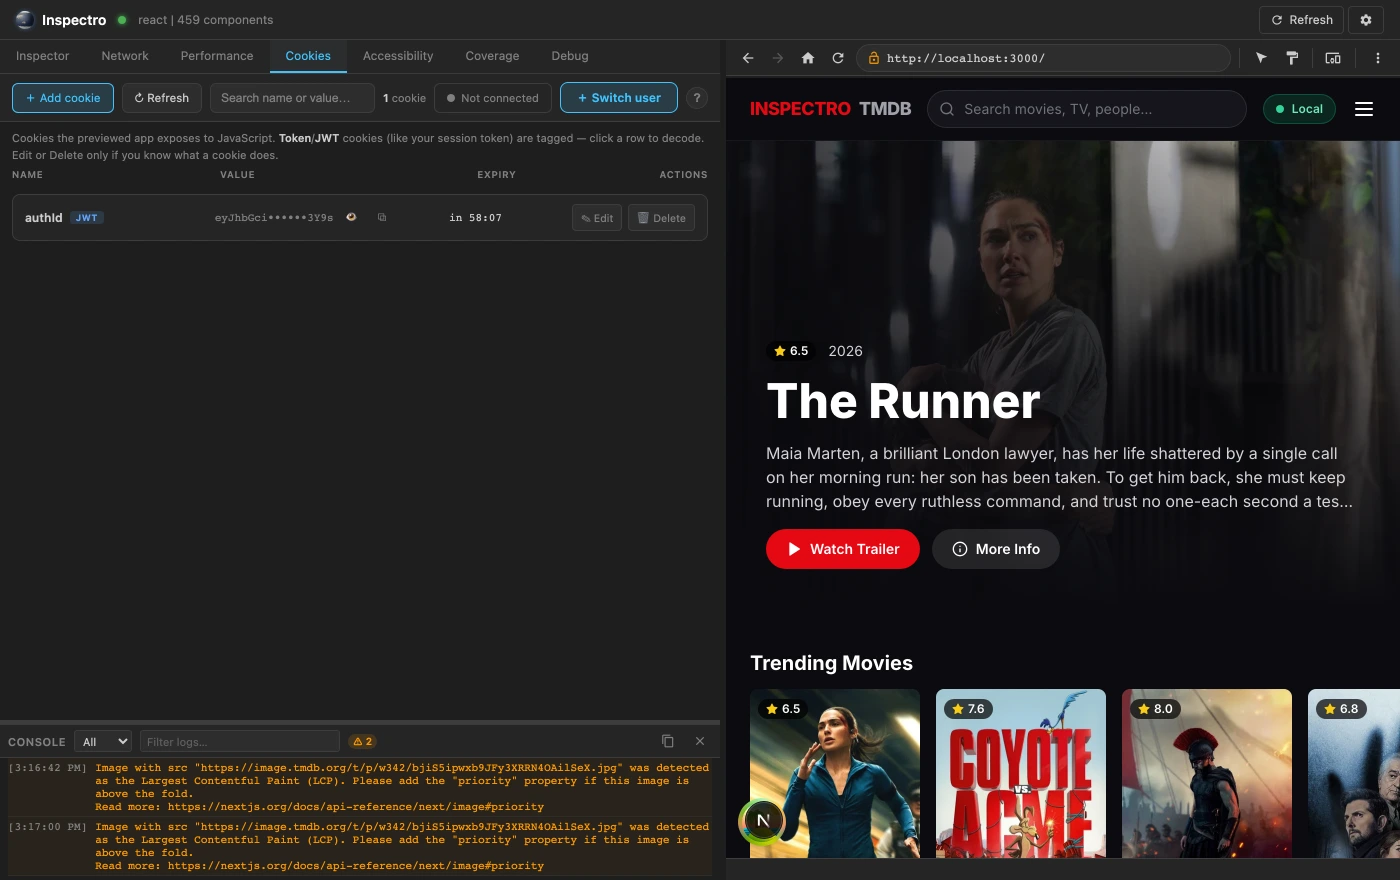
Create, edit and delete cookies for the running app straight from the panel: the session state you control, without a browser round-trip.
You're testing auth or session state and need to change cookies quickly, or start a project from a clean slate.
Inspectro runs the preview on its own session and gives you full cookie CRUD against it, with an option to start each project with a fresh cookie jar.
- Full cookie CRUD for the running app
- Optional clean cookie jar per project for isolation
- Environment and user switching with JWT auth states and VPN statusComing soon
Accessibility
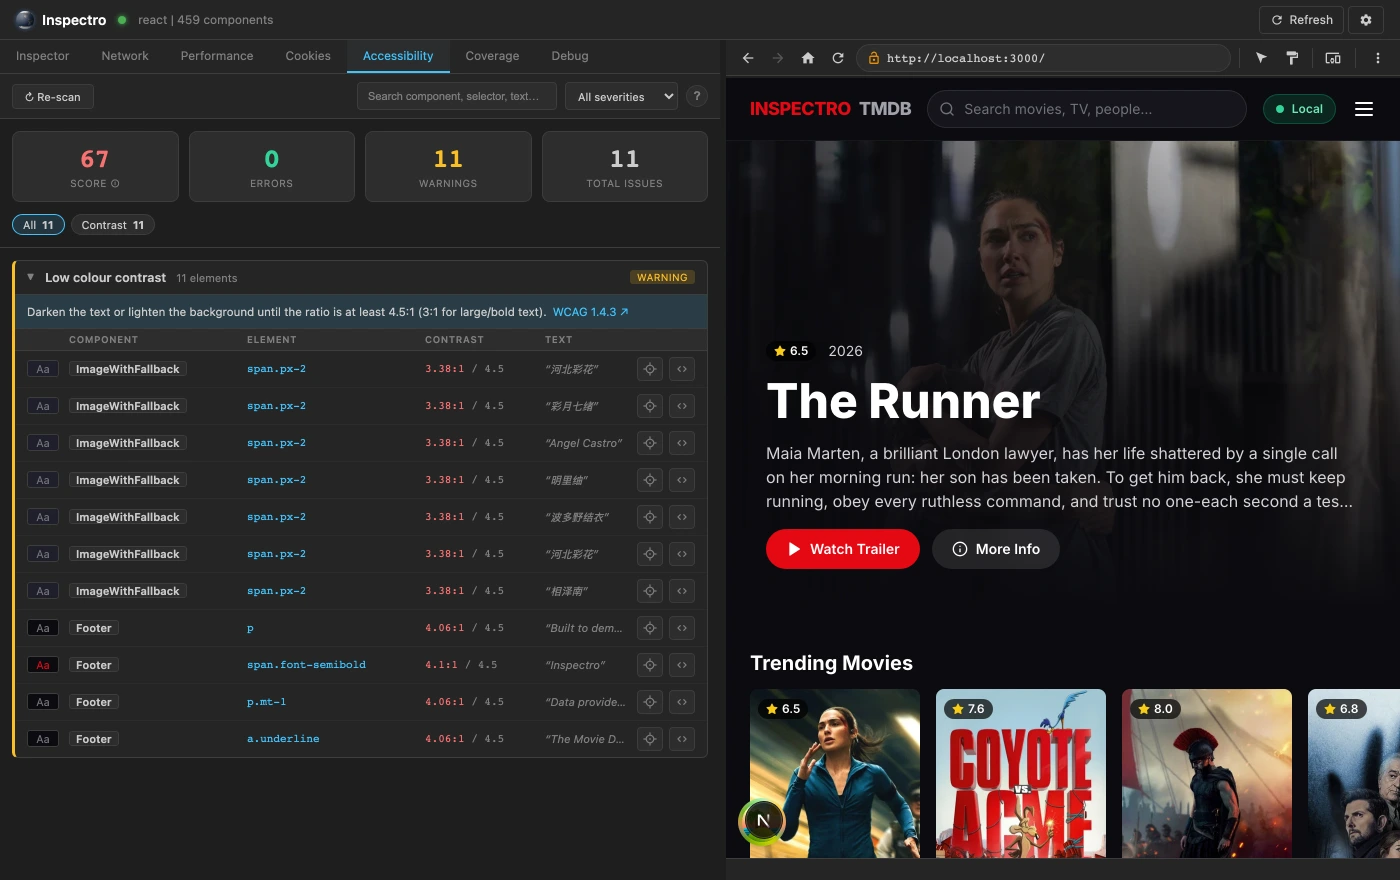
A live accessibility audit of your running app: an overall score with every issue tied to the exact component at fault.
You want accessibility to be part of the build, not a launch-week scramble.
Inspectro checks the rendered app against accessibility rules and streams errors, warnings and passes per component, pushing issues straight into the VS Code Problems panel as you fix them.
- Overall 0–100 accessibility score
- Severity-filtered issues wired to the component at fault
- Issues pushed into the VS Code Problems panel
- Errors, warnings and passes stream in as you fix
Coverage
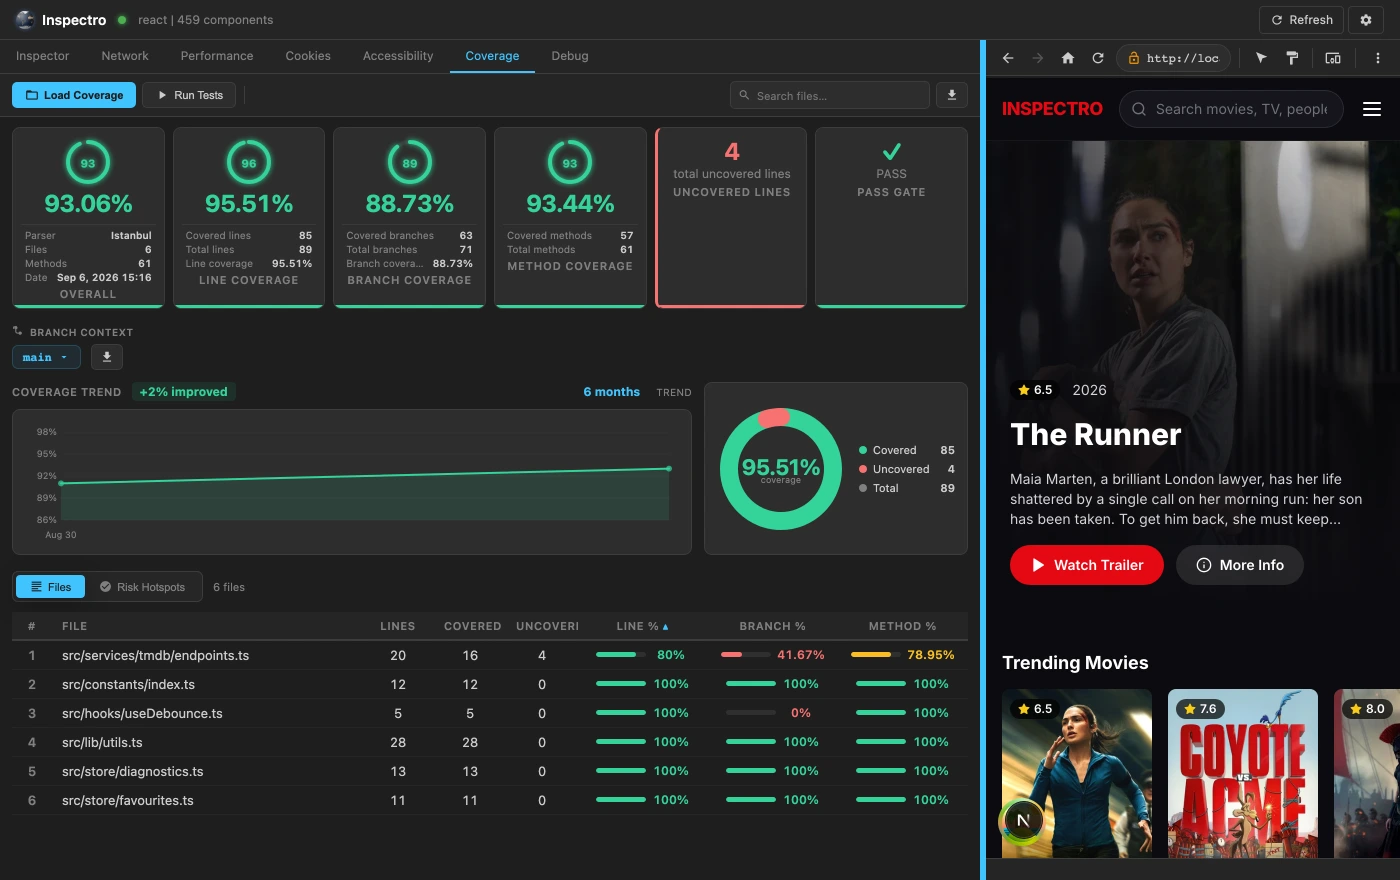
Line, branch and function coverage from your latest run, shown per file and directory next to your source.
After a test run, to see what's actually exercised on the branch you're working on.
Load an .lcov report and Inspectro maps it onto your files and directories, aware of the git branch you're on, exportable as JSON for CI.
- Line, branch and function coverage from .lcov
- Per-file and per-directory breakdown
- Git-branch context, exportable as JSON
- Coverage V2 dashboard: hotspots and trendsComing soon
Debug
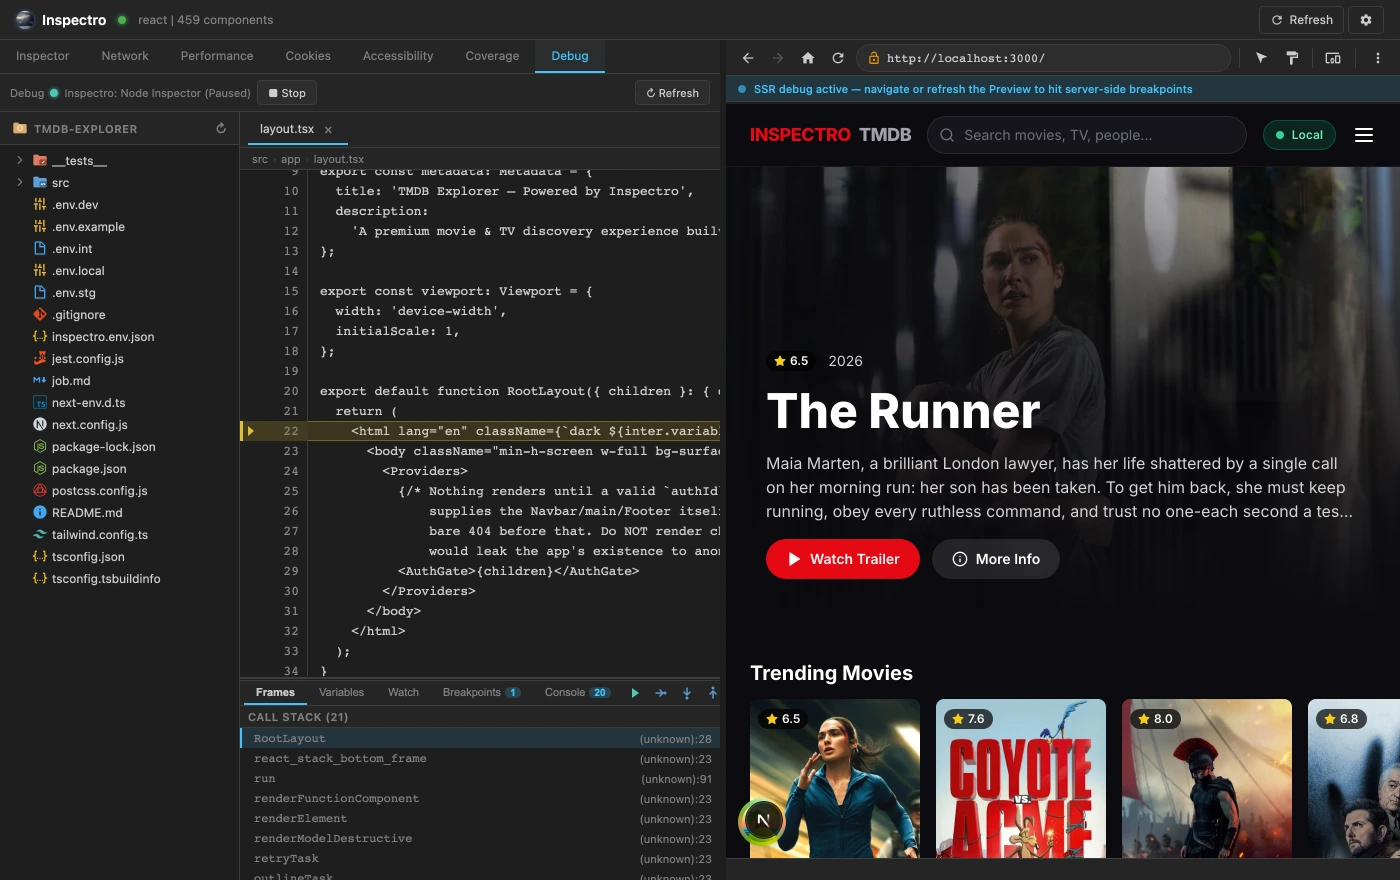
Step through server-rendered and Node/API code (the runtime no other frontend tool lets you debug) with breakpoints synced bidirectionally to VS Code.
The bug only throws on the server, lives in SSR or an API route, or you need to see server execution the browser never shows.
Inspectro attaches over the Chrome DevTools Protocol to the Node runtime for SSR/API code, keeping breakpoints in sync with the editor. Client-side/browser debugging runs over Browser CDP and is currently in beta.
- Node CDP for SSR / API: the mature, unique path
- Breakpoints synchronize bidirectionally with VS Code
- Client / browser debugging (beta)
- Watch and conditional breakpoints, flame chartComing soon
Preview
The persistent right-side panel: a live preview of the running app with a device toolbar, paint overlays, full ancestry and click-to-source.
You're checking responsive states or want to jump from the rendered UI straight into the code behind it.
Inspectro renders the app in the panel beside whatever tab is active, with device modes and overlays, so hovering a component shows its hierarchy and opens it in the browser or your editor.
- Live preview with a device toolbar, always beside the active tab
- Debug-paint overlays and full component ancestry
- Click-to-source from the running UI
Commands & Settings
Inspectro adds these commands to the VS Code command palette (Ctrl/Cmd+Shift+P). Everything else is driven from the panel and the settings above.
Troubleshooting
Changelog
Inspectro is live on the VS Code Marketplace. Every shipped version and what changed in it is on the changelog page.
View release notes