




Every layer.Its own instrument.
Eight deeply integrated surfaces, one workspace. Here is what Inspectro sees when it looks inside your frontend.
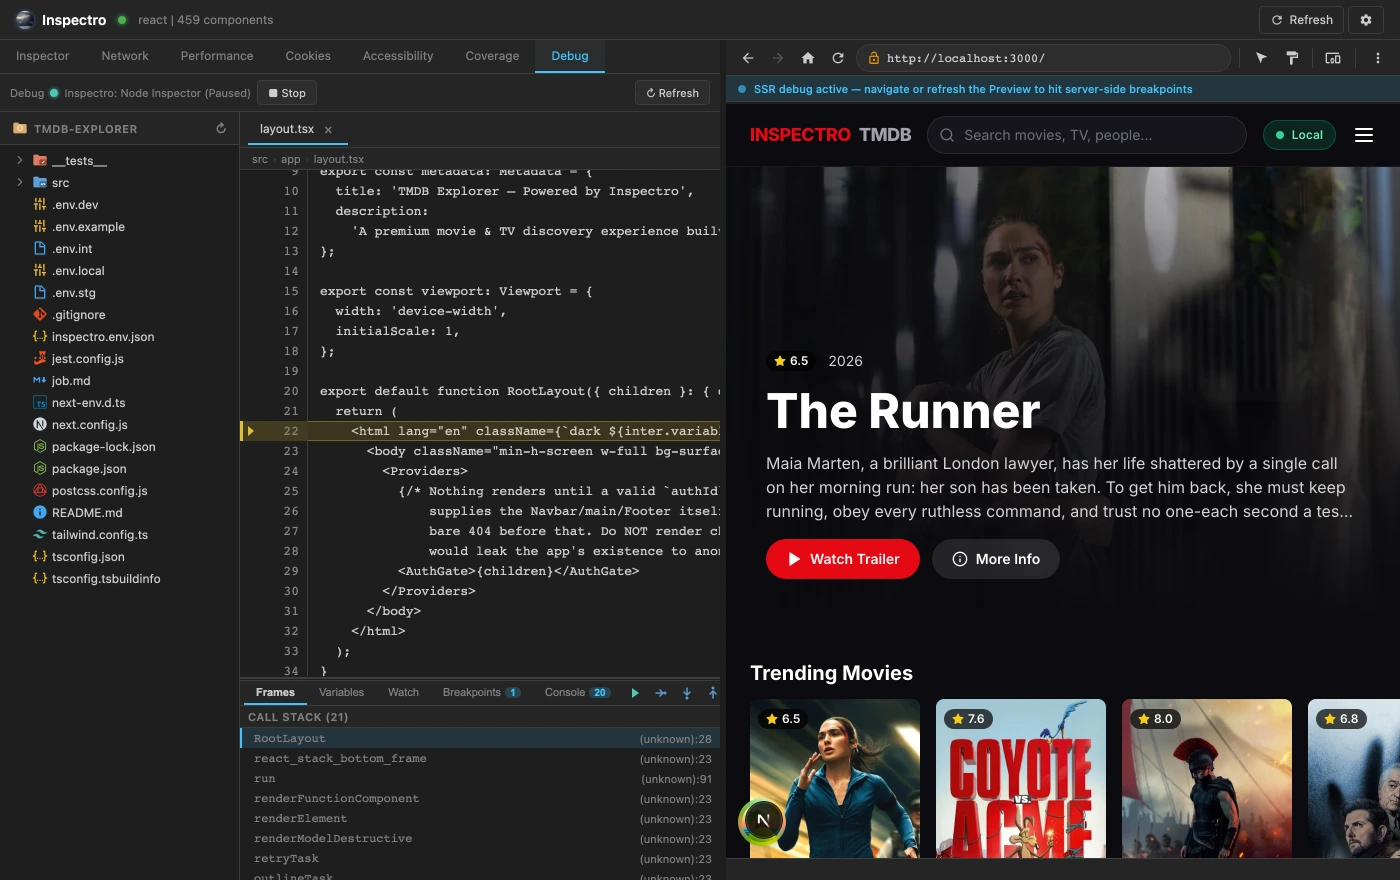
Debug the server your browser never could.
The one thing no other frontend tool does: step through server-rendered and Node/API code over CDP, with breakpoints synced bidirectionally to VS Code, so SSR stops being a blind spot. Client-side debugging is in beta.
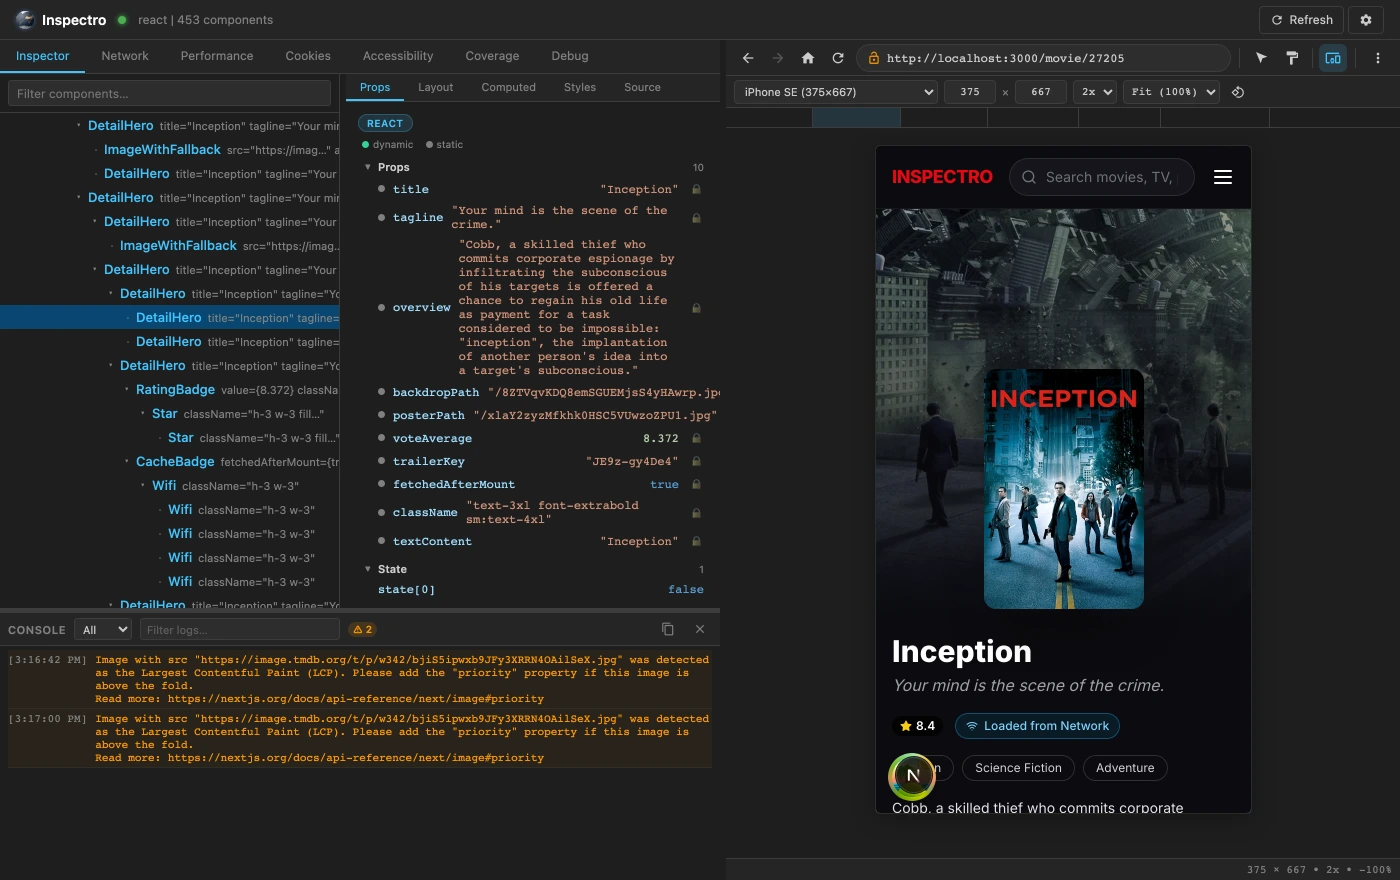
See your component tree. Jump straight to source.
Select any element in the preview and Inspectro reveals its component, props, state and the exact line of source that rendered it. Edit React props live and watch the UI update instantly.
Write-back to source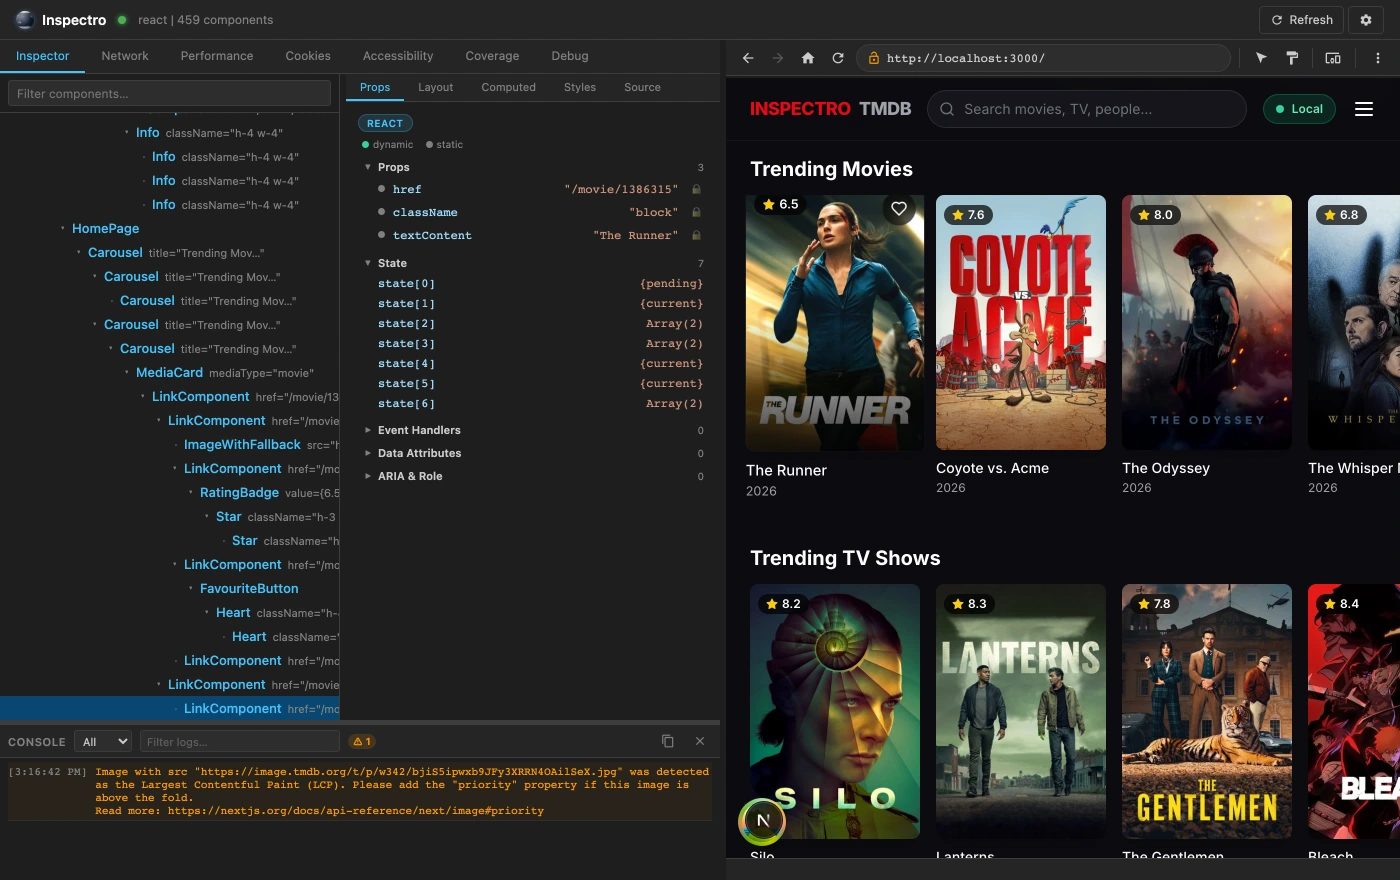
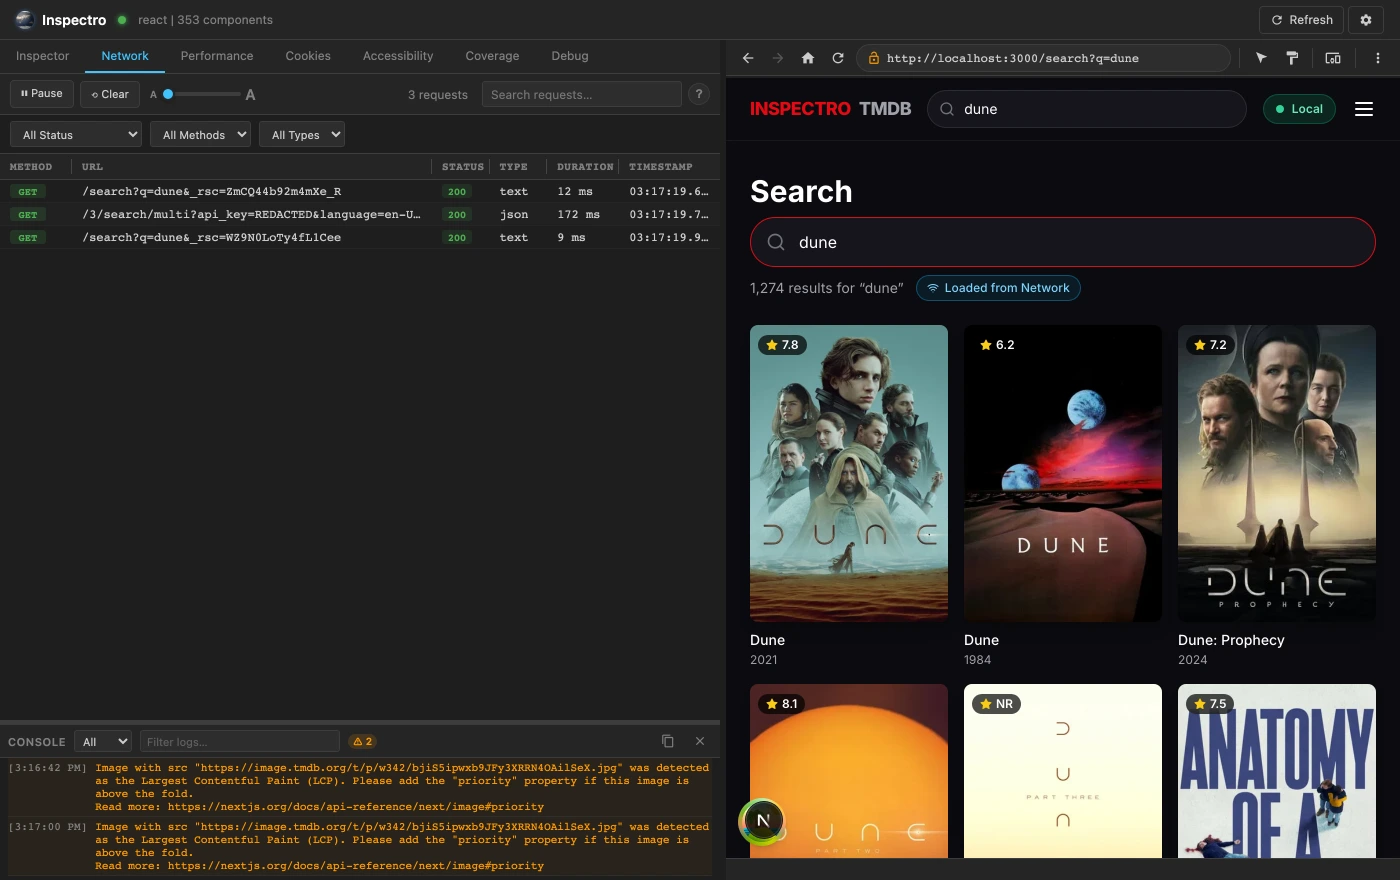
Record continuously. Pause when it matters.
Every request, response, header and payload, captured as it happens and correlated with the component that triggered it. The failing checkout call is never a mystery again.
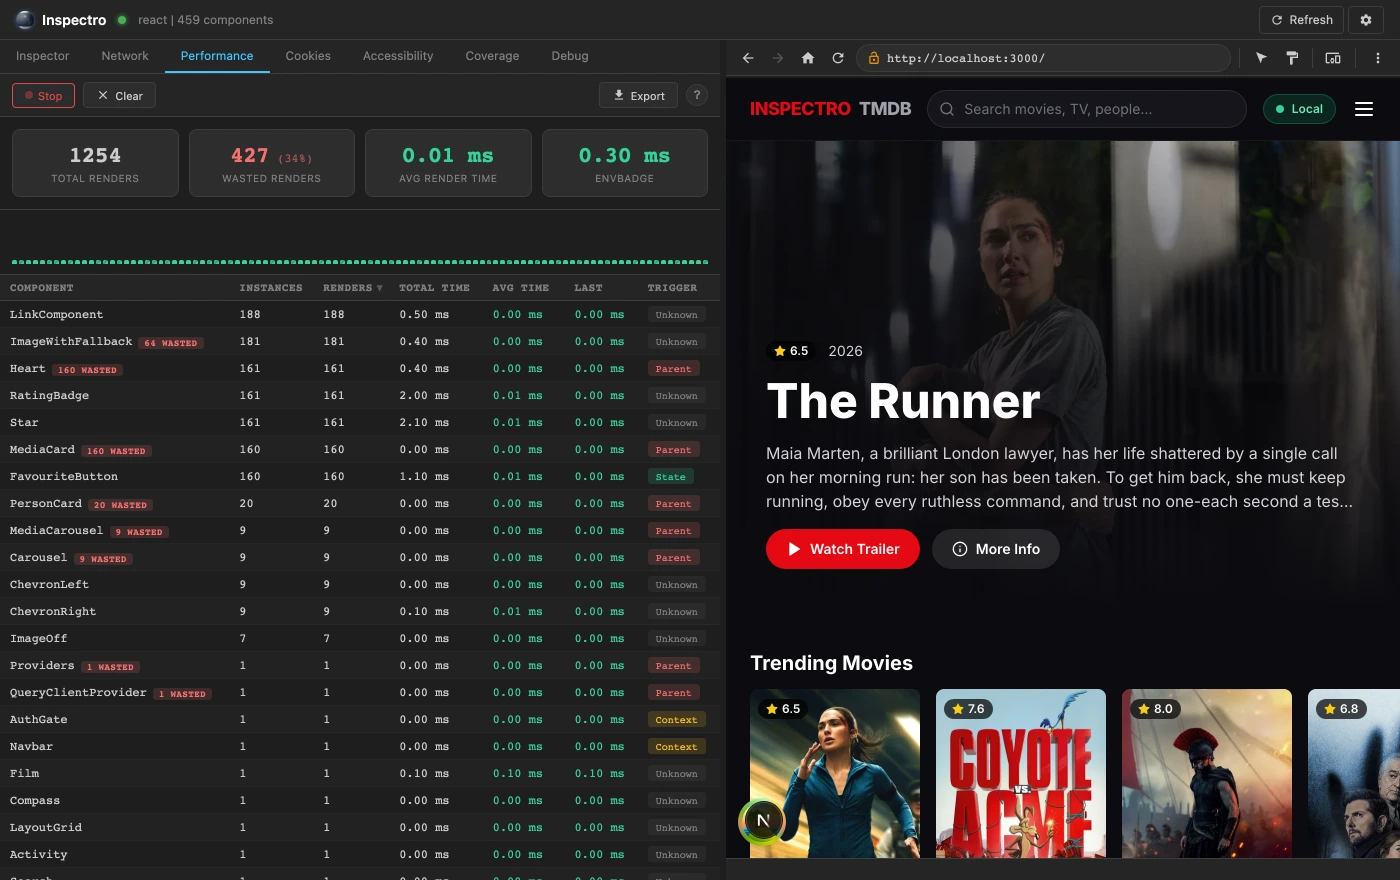
Measurement, not generic analytics.
Render counts, average render time and the triggering context for every component in the tree. Find the ResultsList re-rendering 27 times before your users feel it.
Own your cookies. Environments next.
Create, edit and delete cookies for the running app right in the panel: the session state you control, without a browser round-trip. Start each project with a clean jar when you need isolation.
Env & user switching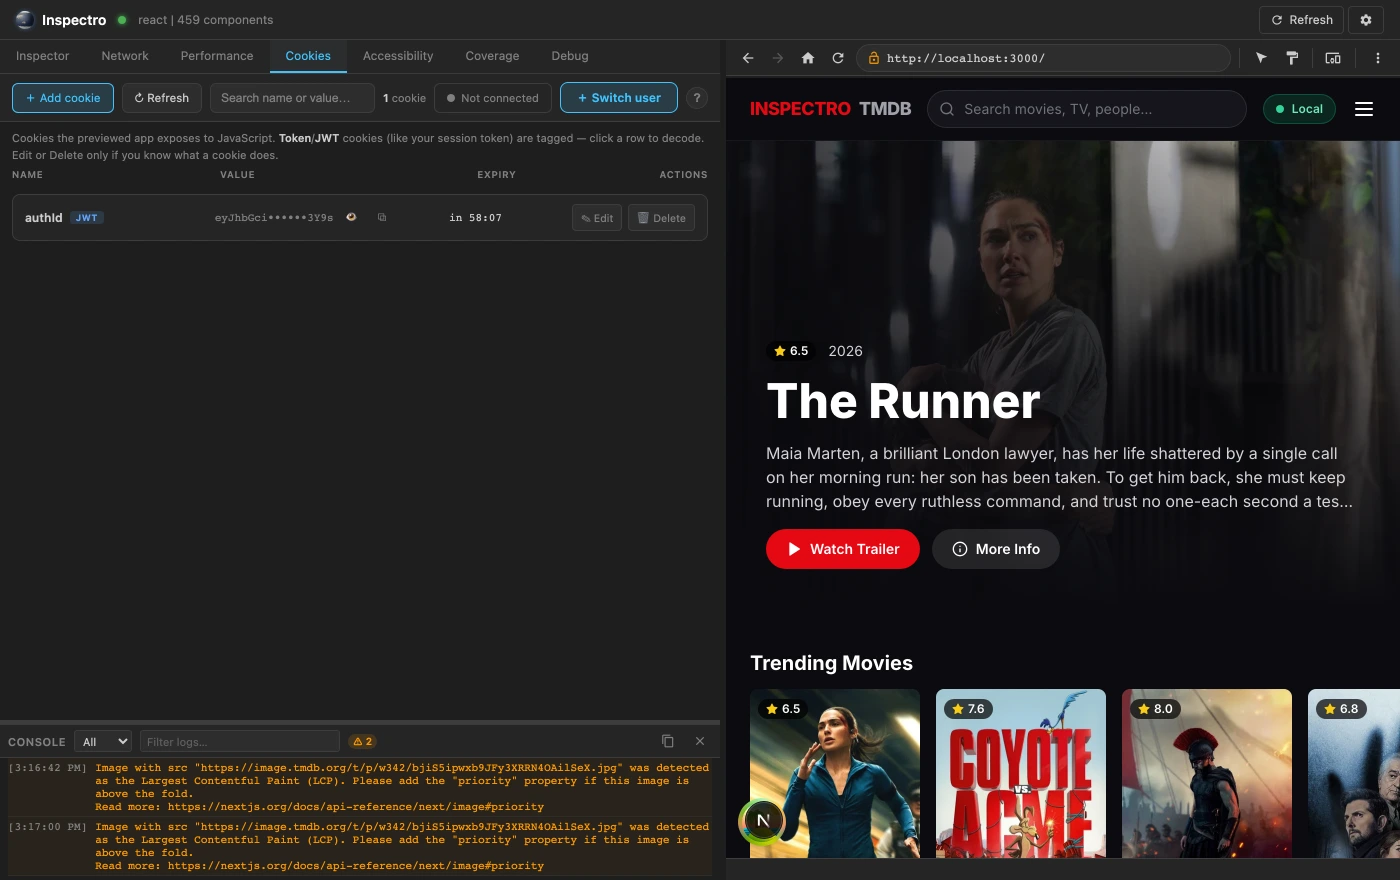
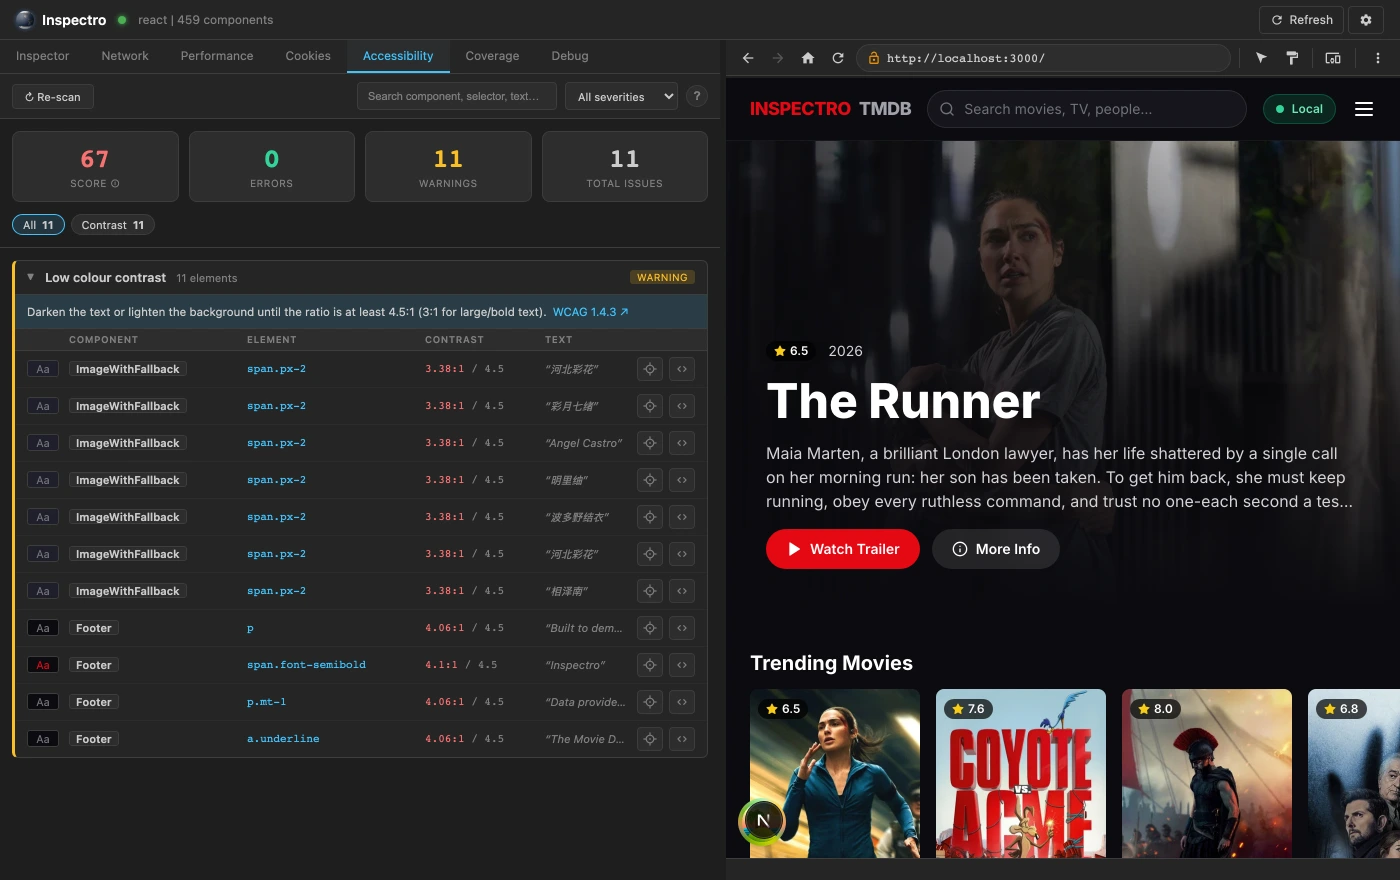
A11y as an engineering workflow, not a checkbox.
Severity-filtered audits wired to the exact component at fault. Errors, warnings and passes stream in as you fix them, so accessibility becomes part of the build, not a launch-week panic.
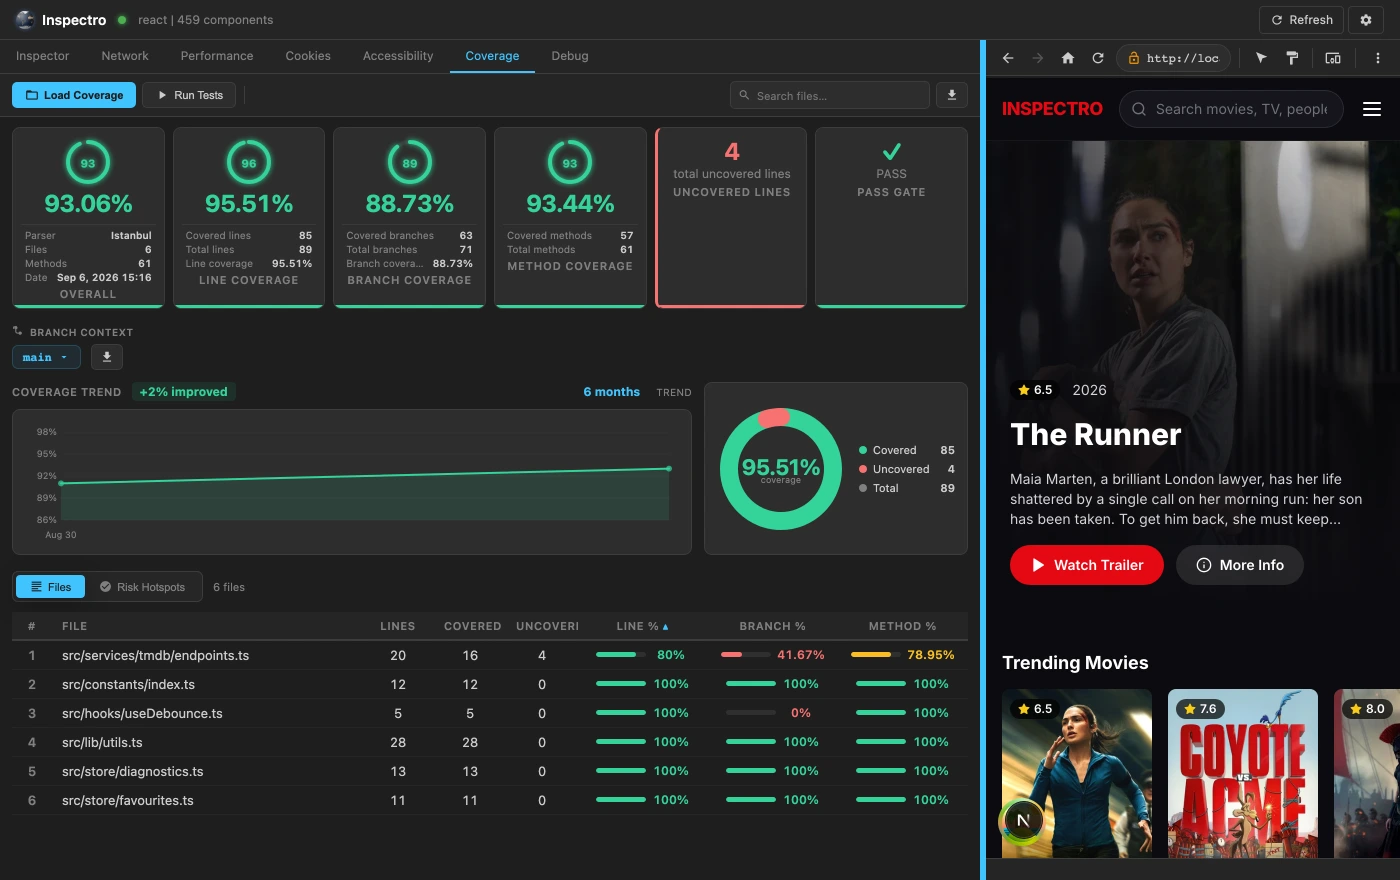
Coverage that lives next to your source.
Load .lcov from your latest run and see line, branch and function coverage per file, mapped to the branch you're on and exportable as JSON for CI.
Click-to-source, straight from the running UI.
A live preview with device toolbar, debug paint overlays and full ancestry. Hover a component, see its hierarchy, open it in the browser, or in your editor.
Don't just inspect where your UI is.Understand how it got there.
Timeline replay: scrub any component back through every render, prop and network event that shaped it. A preview of where Inspectro is headed.
01Initial render
ProductCard mounts with price 249.00 and zero interaction state.
02State change
User opens the size selector: local state flips, one re-render.
03Prop change
Parent passes a discount prop. Diff captured and highlighted.
04Network response
Inventory call resolves and injects stock count into props.
05Re-render
PriceTag re-renders with the resolved campaign price.
06Current state
Scrub back to any snapshot. The UI rewinds with it.
Not a UI wrapper.
A signal pipeline.
A lightweight runtime lives inside your app and streams instrumentation to the DevTool in your editor, bidirectionally.
"I scout the runtime so you don't have to."
Every bug is observable.
It lives in a layer: a render, a request, a server path. See the layer and you've found the bug. We build instruments, not opinions.
What you can see, you can fix.
The hard ones hide where the browser won't look: SSR execution, the prop that arrives undefined, the call that fired three components deep. We put them on screen.
We make the invisible obvious.
Component, source and runtime, connected live: one continuous surface of truth, no blind spots between tools. See the invisible.